Software · macOS · In development
ProcView
The Activity Monitor your Mac should have shipped with.
The app
What ProcView is.
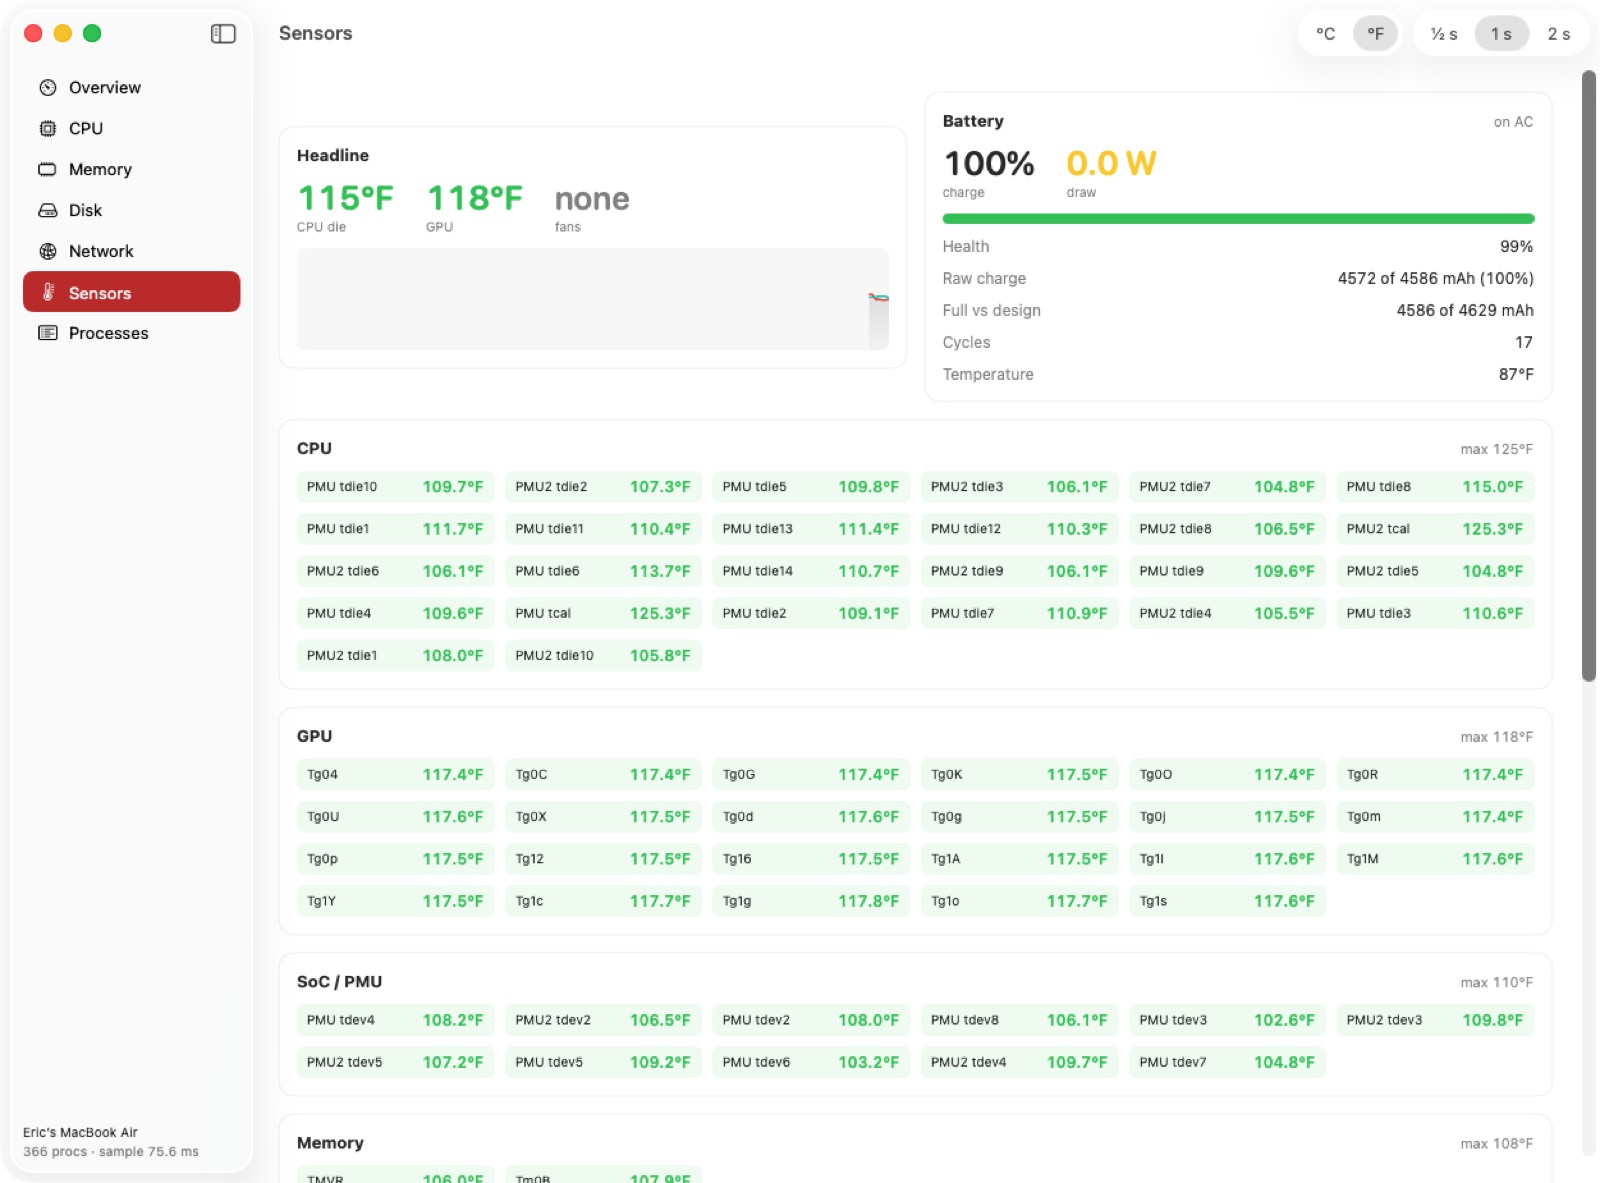
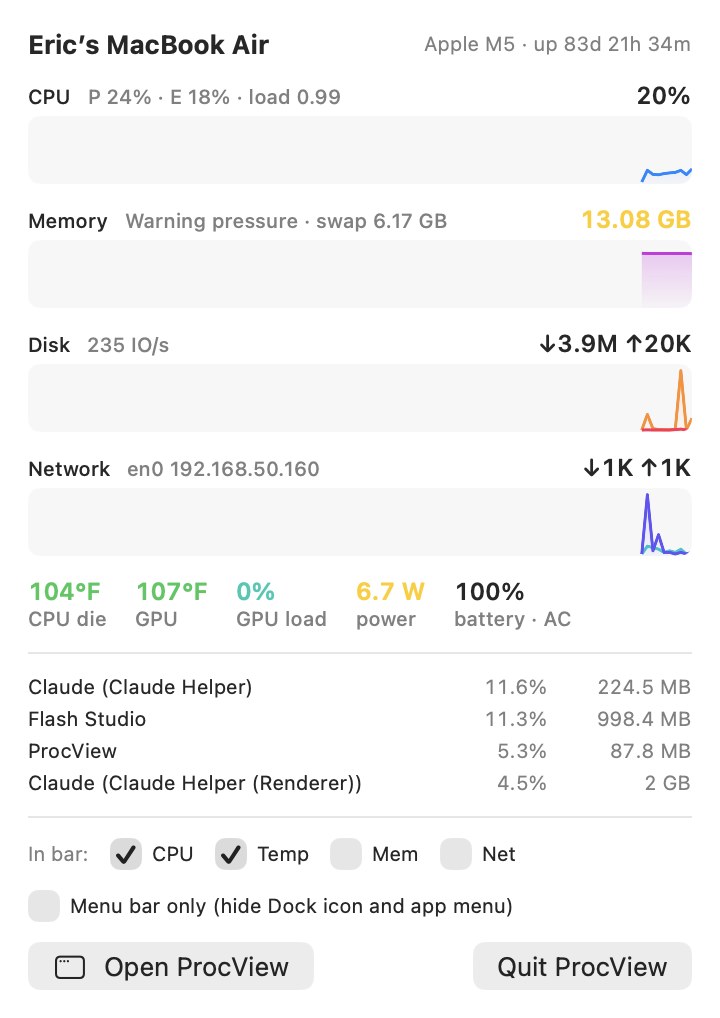
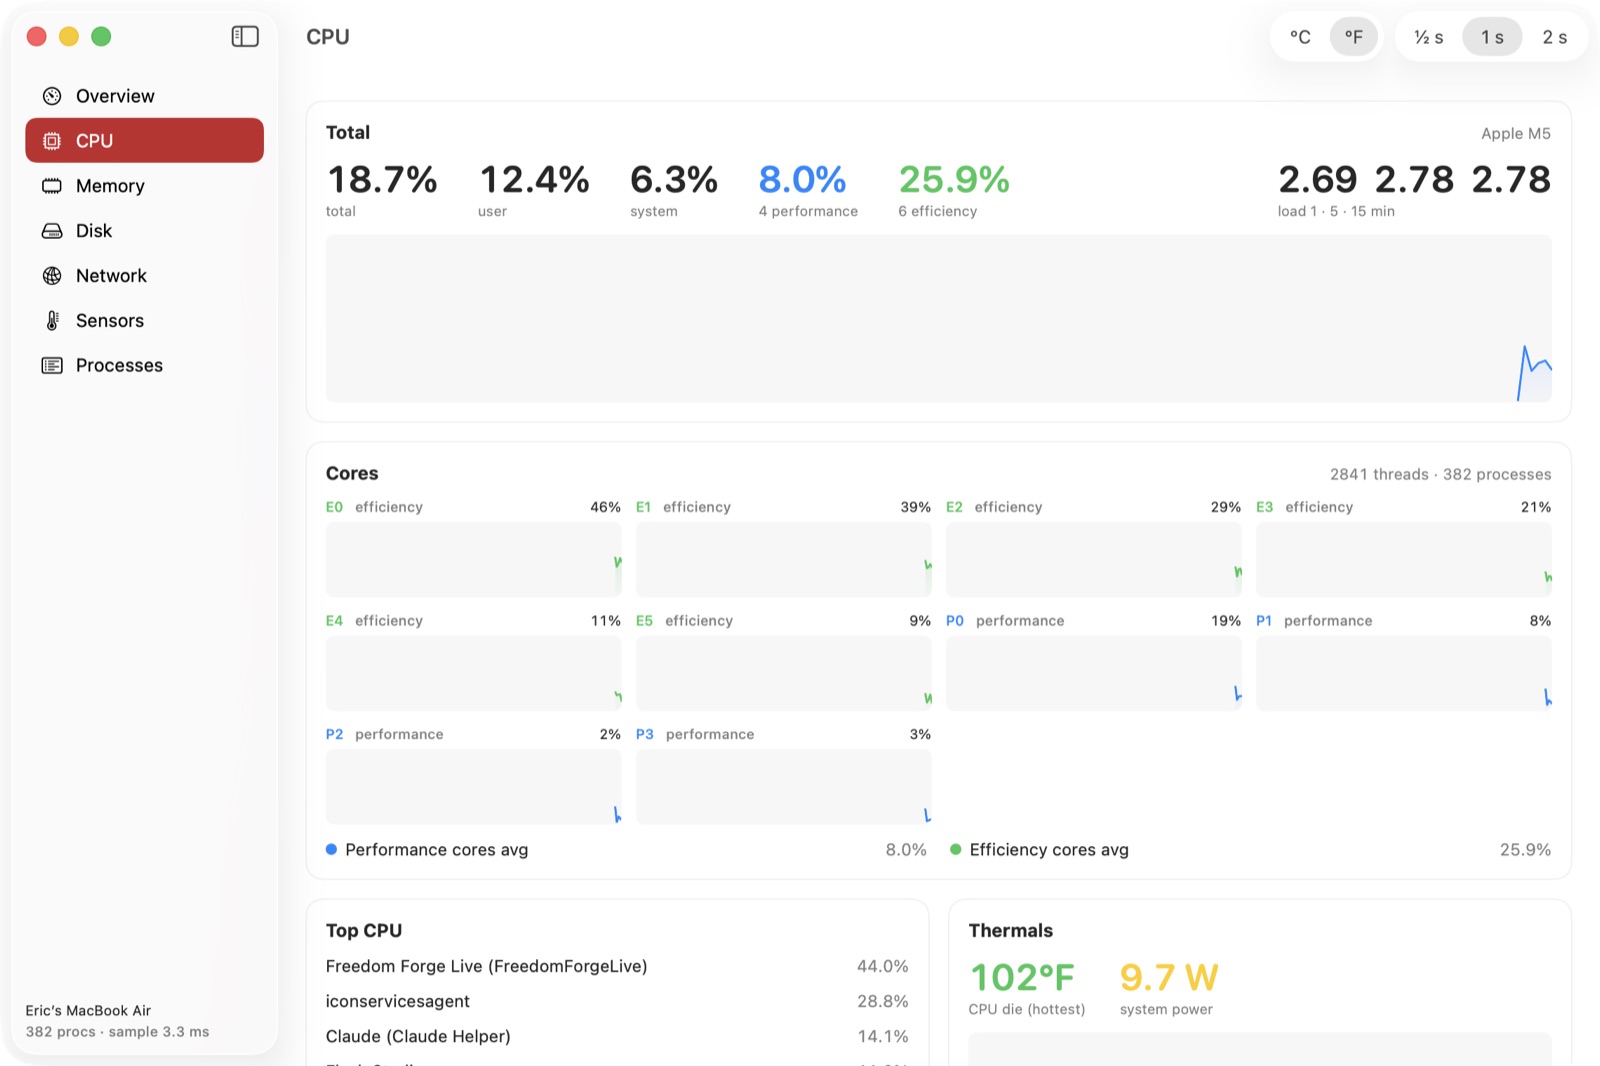
One window that answers "why is my Mac slow right now": every core graphed on its own with the performance and efficiency split, memory pressure and what is using it, disk and network throughput, GPU load, die temperatures, fans, power draw, battery, and a process table with quit and force quit. A menu bar readout keeps the numbers in view. Native Swift, no Electron, and no network access at all.
- Measured, never invented. Readings come straight from the kernel, IOKit, and the SMC; a sensor that is unavailable is shown as unavailable rather than guessed.
- Temperatures in °C or °F, sampling at ½, 1, or 2 seconds, and two minutes of history on every graph.
- Menu bar mini view with a popover dashboard. Run it menu-bar-only if you prefer.
Apple siliconmacOS 14+Native SwiftUnder 1 MB
Screens
ProcView, as it runs today.